Gifts a Santa Claus-themed equity rally might deliver in 2023
Nov 27, 2023 | CMC InvestWith Christmas just around the corner, traders are seeking ways to enhance their holiday finances - one potential avenue for this is the widely recognised financial phenomenon called the Santa Claus Rally.
With Christmas just around the corner, traders are seeking ways to enhance their holiday finances with just a month remaining. One potential avenue for this is the widely recognized financial phenomenon called the Santa Claus Rally.
So, what exactly is a Santa Claus rally? The Santa Claus Rally refers to a recurring seasonal pattern in the stock market where stocks generally experience an increase toward the close of the fiscal year. Initially observed by Yale Hirsch and detailed in his 1972 book, 'The Stock Trader's Almanac,' the Santa Claus Rally has historically manifested 76% of the time between 1950 and 2019. According to the Almanac, the market demonstrated an average annual increase of 1.3% during this timeframe.
While the statistical aspect is intriguing, predicting the exact occurrence and timing of the Santa Claus Rally in the markets remains challenging. For instance, the media occasionally designates the Santa Claus Rally as the period starting on Thanksgiving Day, a movable holiday falling on the fourth Thursday in November in the US, and extending throughout December. According to Hirsch, the Santa Claus Rally typically transpires in the final week before 25 December, continuing until 02 January.
Conversely, the week following the Christmas holidays is traditionally marked by a subdued atmosphere. This trend is logical as many market participants take time off, resulting in low trading volumes. The diminished liquidity often leads to lateral price movements, occasionally punctuated by brief and intense volatility swings. These fluctuations are more likely to occur during the Asian session, characterised by lower liquidity compared to the London or New York sessions.
For this, we shall consider the Santa Claus Rally as unfolding five days prior to the Christmas holiday. The figure below illustrates how this phenomenon has played out over the past two decades.
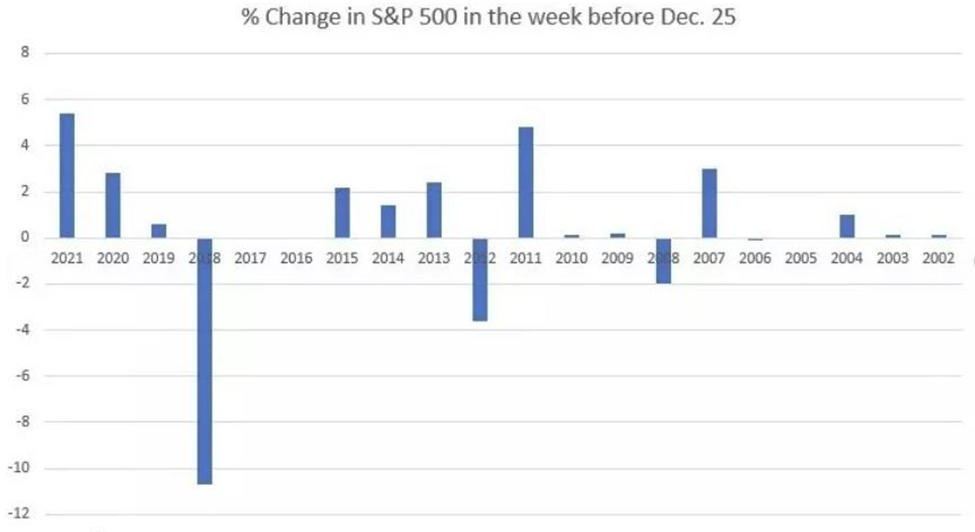
Source: Investopedia
Observing this timeframe, it becomes apparent that, in the majority of instances, there was an increase in share prices, with two instances seeing gains surpassing 4%. However, in eight instances, the growth was below 1%, and in three cases, losses were incurred. Thus, the Santa Claus Rally emerges as a statistically probable yet not assured phenomenon, with the extent of index appreciation exhibiting considerable variability during this period.
An effective and straightforward method to replicate the performance of the S&P 500 involves investing in ETFs. At CMC Invest, we provide our clients with access to these specific ETFs.
1) SPDR S&P 500 ETF (SPY):
- Expense Ratio: SPY has a low expense ratio, making it cost-effective for investors.
- Liquidity: Being one of the most traded ETFs, SPY offers high liquidity, making it easy for investors to buy and sell shares.
- Dividend Yield: SPY tends to have a competitive dividend yield compared to other S&P 500 ETFs.
2) iShares Core S&P 500 ETF (IVV):
- Expense Ratio: IVV has a competitive expense ratio, making it an attractive option for cost-conscious investors.
- Asset Size: IVV is one of the largest ETFs tracking the S&P 500, indicating a substantial asset base.
- Tracking Error: IVV aims to closely track the S&P 500, and historically, it has exhibited low tracking error.
3) Vanguard S&P 500 ETF (VOO):
- Expense Ratio: VOO boasts one of the lowest expense ratios among S&P 500 ETFs, making it highly cost-effective.
- Ownership Structure: VOO is managed by Vanguard, known for its unique ownership structure, which aligns with the interests of its investors.
- Dividend Distribution: VOO distributes dividends quarterly, and its dividend yield may vary slightly from other S&P 500 ETFs.
Possible theories behind the Santa Claus Rally:
- Investors are gearing up for the "January effect," a distinct calendar phenomenon where certain stocks tend to experience greater gains than others in the early days of January following the holidays. This effect is believed to stem from the strategic realisation of tax losses in December to minimise tax liabilities. Investors achieve this by offsetting realised losses against realised gains, subsequently repurchasing the shares in January.
- The Santa Claus rally is attributed to the holiday-related absence of institutional investors, who refrain from active trading during this period and short selling which they would normally do, doesn’t happen. This theory rests on the premise that retail investors, often exhibiting a more bullish stance, exert a significant influence on the market when institutional participation is reduced, thereby leading to an increase in stock prices.
- The heightened expenditure on goods towards the end of year contributes to improved profits for businesses in the final quarter of the year. The market anticipates this positive financial impact and factors it into stock prices in advance.
In conclusion, both investors and traders might wish to incorporate cyclical trends as part of their investment decision, alongside any form of technical analysis and fundamentals, which can add another dimension to their repertoire of trading strategies. The Santa Claus Rally is an example of such a trend. Nevertheless, it's crucial to bear in mind that past performance does not necessarily ensure comparable behaviour in the future. In reality, various factors and risks exist that could lead to differences in market dynamics this year.
Disclaimer: CMC Markets Singapore may provide or make available research analysis or reports prepared or issued by entities within the CMC Markets group of companies, located and regulated under the laws in a foreign jurisdictions, in accordance with regulation 32C of the Financial Advisers Regulations. Where such information is issued or promulgated to a person who is not an accredited investor, expert investor or institutional investor, CMC Markets Singapore accepts legal responsibility for the contents of the analysis or report, to the extent required by law. Recipients of such information who are resident in Singapore may contact CMC Markets Singapore on 1800 559 6000 for any matters arising from or in connection with the information
such articles? Stay up-to-date with regular market insights and analysis, investing tips and more, delivered directly to your inbox.
 Invest with transparency today