The Rule for First Wave in Elliot Wave Theory
Here are the two key points:
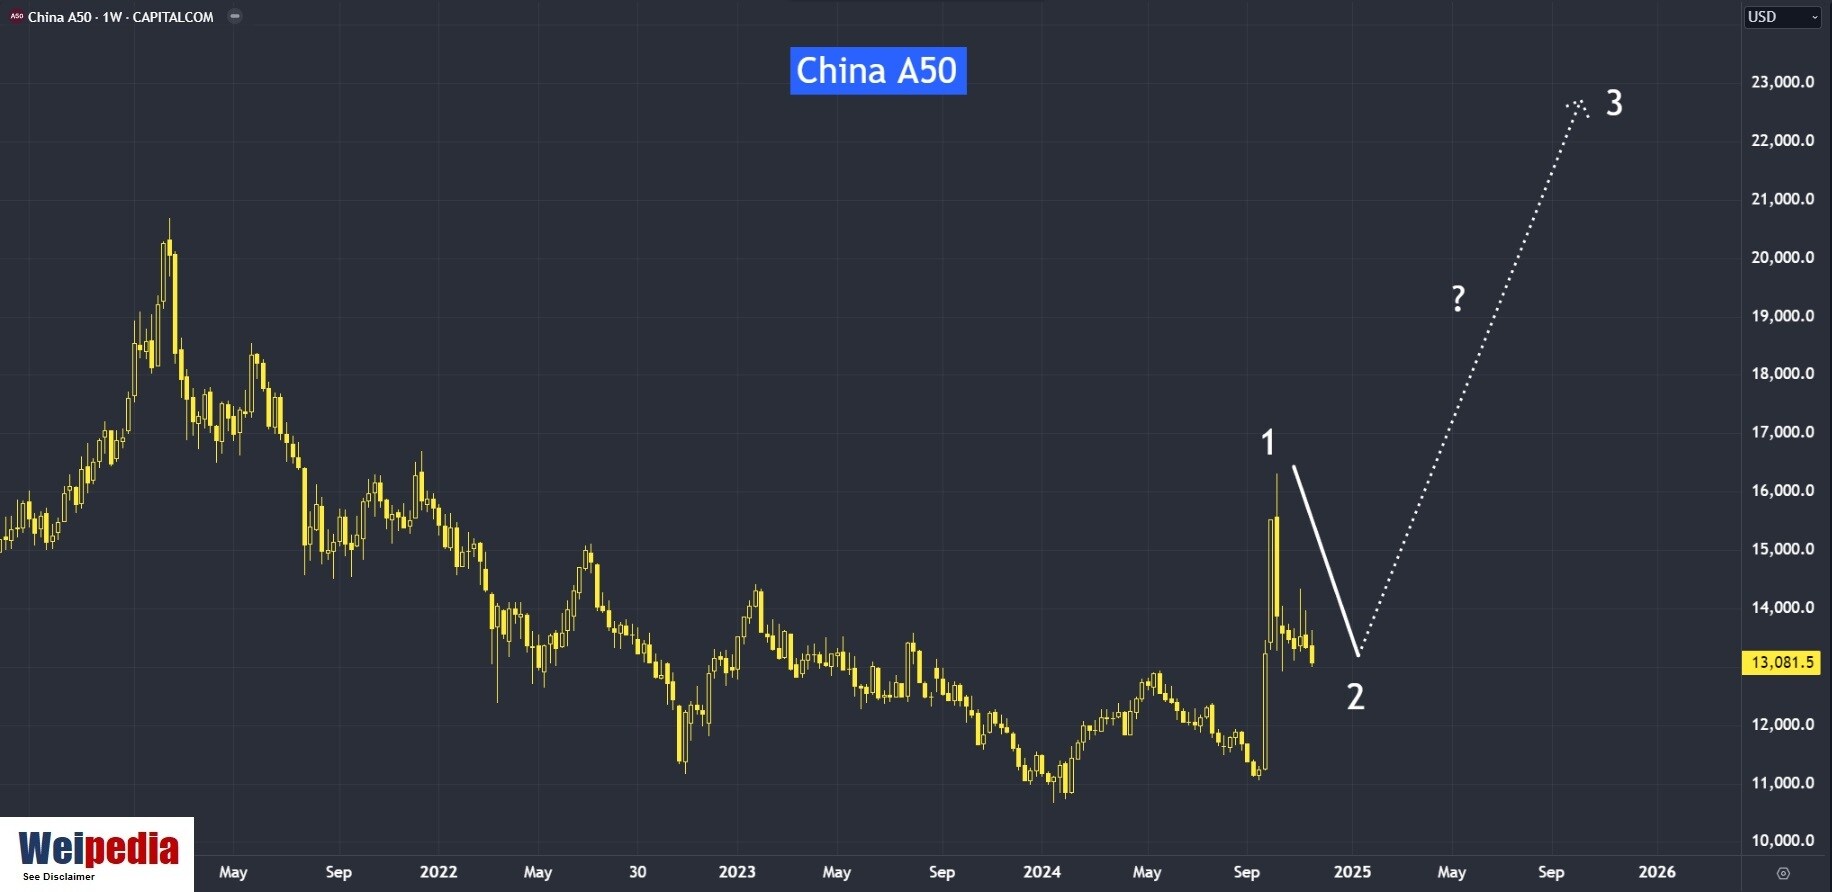
- The first wave often develops after a significant market low, marking a reversal in trend direction.
- It is typically triggered by a shift in market sentiment, such as new economic data, policy changes, or geopolitical events.
As long as the 2024 low is not breached, there is potential for a third wave to form. The first wave aligns well with the principles of Elliott Wave Theory.

Source: TradingView
Are Chinese Stocks Entering Their Second Wave?
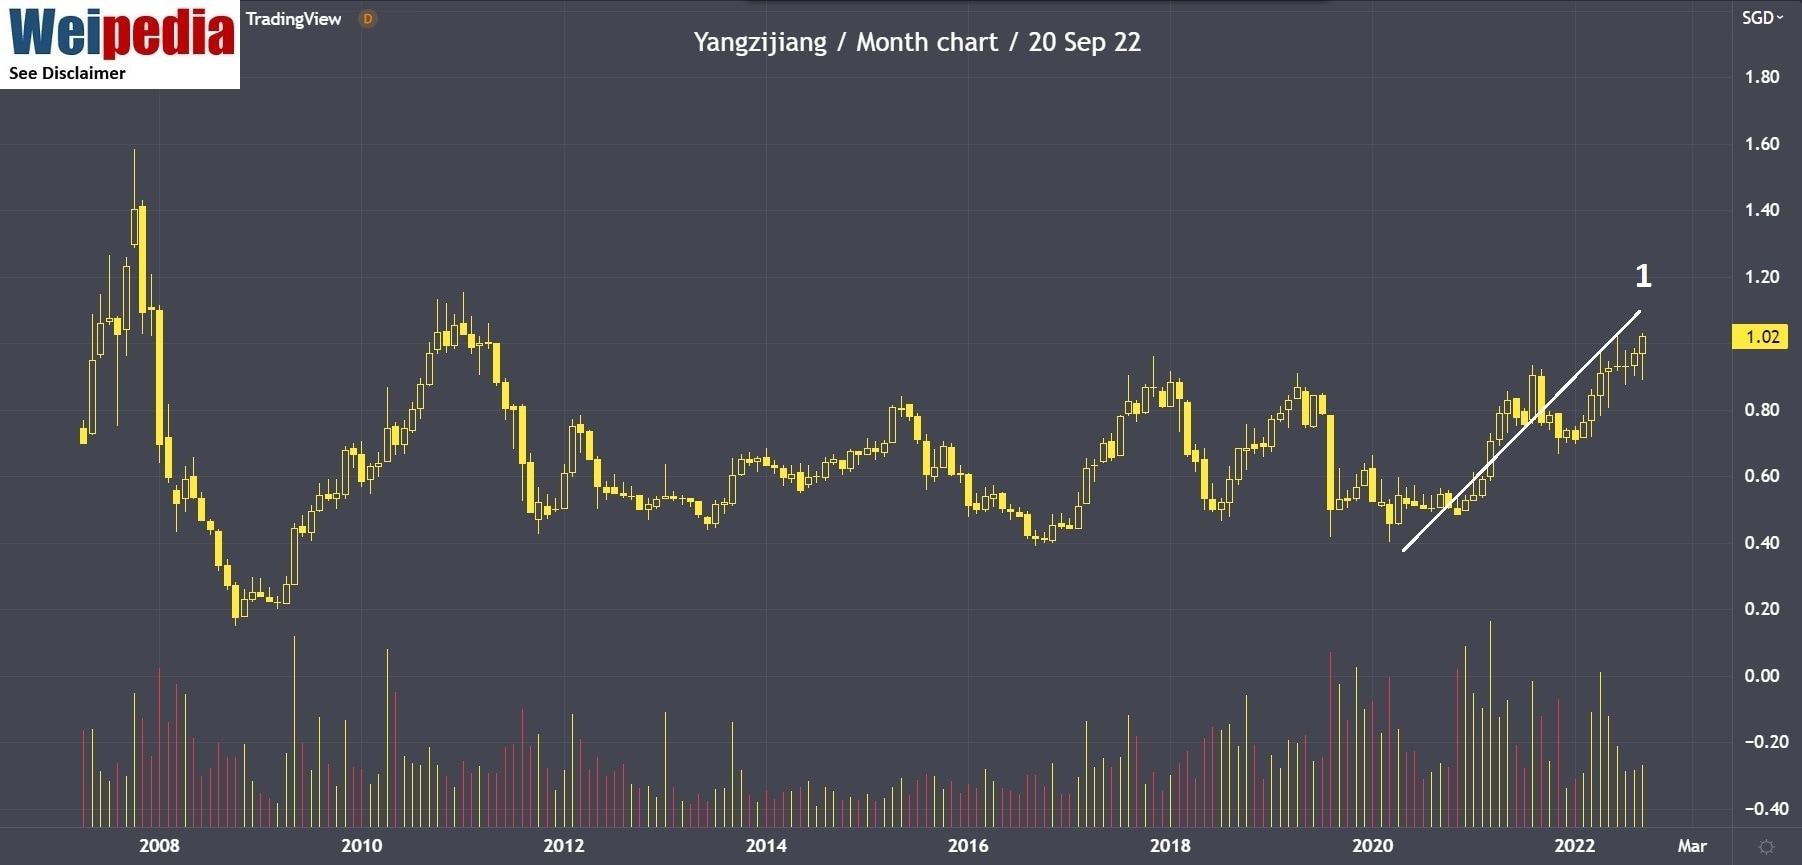
According to Elliott Wave Theory, the second wave must not retrace 100% of the first wave. If it does, the first wave is invalidated, indicating that the larger trend has not changed. An example we analyzed on 20 September 2022 was Yangzijiang Shipbuilding. With fundamental considerations and the formation of its first wave, we identified its growth potential.

Source: TradingView
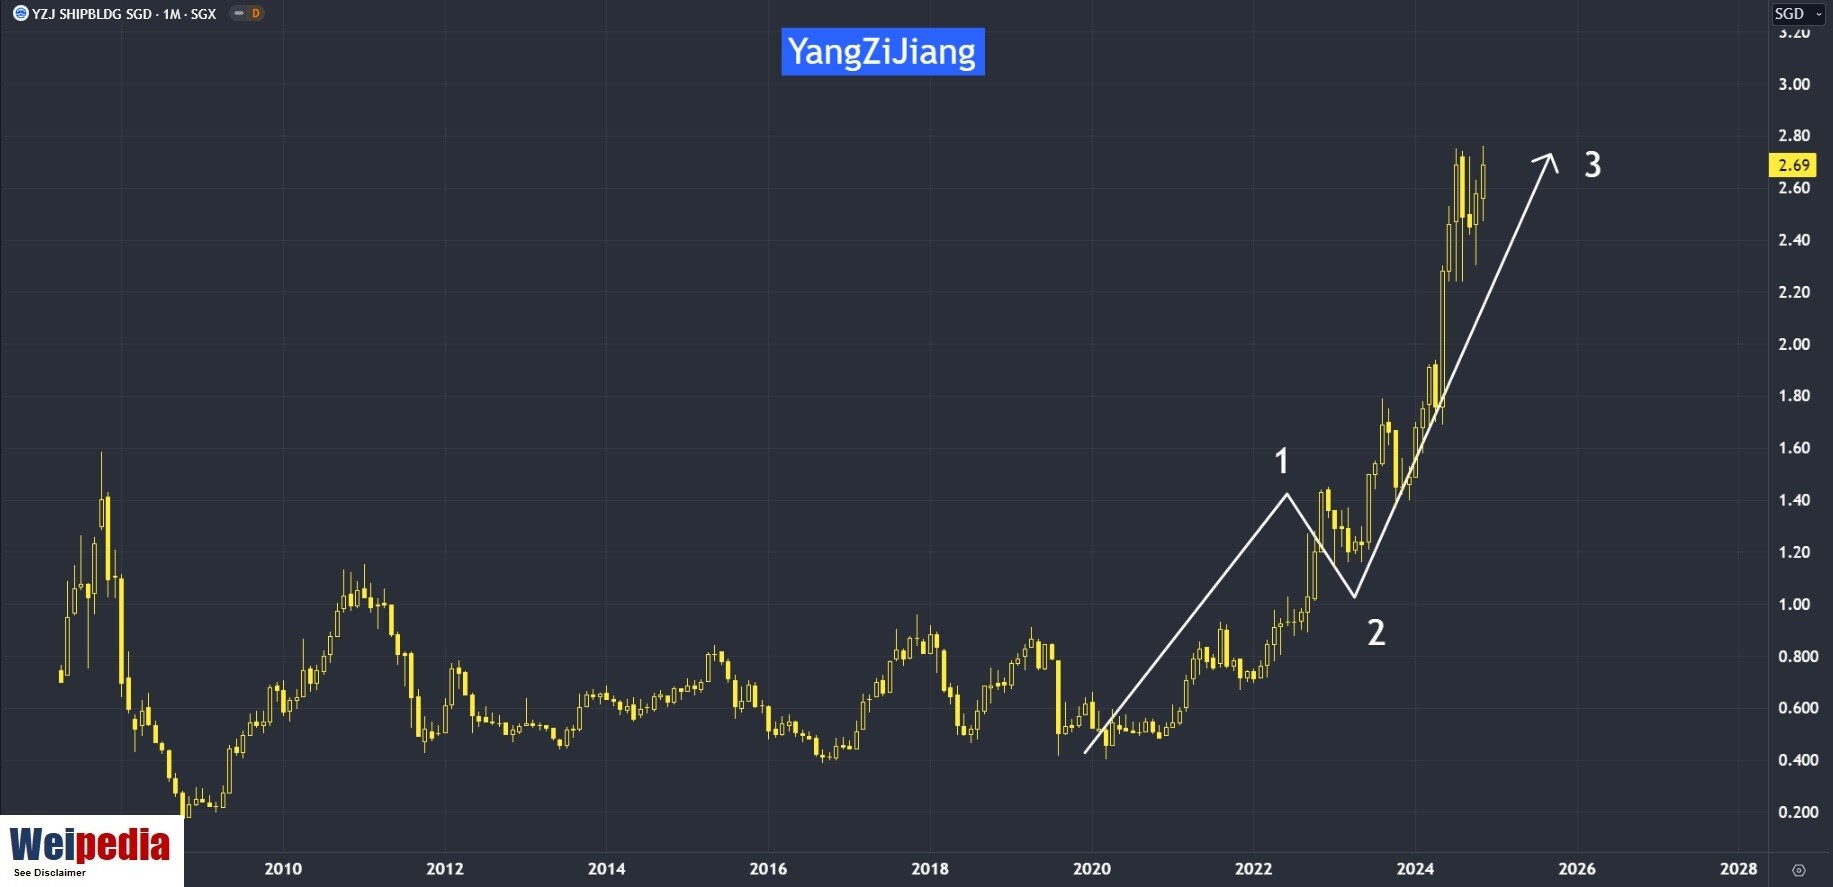
The entry point can be during the first or second wave, provided the stock is trading at a fair value and exhibits growth potential. This aligns with the objective of capturing the third wave in Elliott Wave Theory. Currently, the stock is riding its third wave (see the chart below).

Top 20 Singapore Stocks with Over 50% Revenue from Greater China
| 20 most traded Singapore stocks that reported at least half their revenue to Greater China in the last FY | Code | Mkt Cap S$M | TR % 20 Sep - 9 Oct | ADT S$M YTD | TR % YTD | NIF S$M YTD | P/B (x) | 5-yr avg P/B (x) | Sector |
| Wilmar Intl | F34 | 20,726 | 5.7 | 17.08 | -2.1 | -62.6 | 0.80 | 1.01 | Consumer Non-Cyclicals |
| HongkongLand USD | H78 | 11,626 | 11.3 | 10.50 | 22.6 | 25.0 | 0.29 | 0.29 | Real Estate (excl. REITs) |
| Nanofilm | MZH | 554 | 3.0 | 3.56 | -6.2 | -20.0 | 1.47 | 5.13 | Technology |
| CapLand China T | AU8U | 1,398 | 9.3 | 2.57 | -4.1 | -49.1 | 0.66 | 0.74 | REITs |
| Geo Energy Res | RE4 | 407 | 13.7 | 2.51 | -14.2 | 0.6 | 0.71 | 0.91 | Energy/ Oil & Gas |
| DFIRG USD | D01 | 3,907 | 16.6 | 2.30 | -4.9 | -14.4 | 3.17 | 4.19 | Consumer Non-Cyclicals |
| YZJ Fin Hldg | YF8 | 1,423 | 17.4 | 2.26 | 33.2 | 26.9 | 0.36 | 0.33 | Financial Services |
| Yanlord Land | Z25 | 1,362 | 78.5 | 1.90 | 21.6 | -15.3 | 0.22 | 0.30 | Real Estate (excl. REITs) |
| NIO Inc. USD OV | NIO | 15,283 | 13.2 | 1.58 | -36.0 | -10.0 | 5.49 | 5.24 | Consumer Cyclicals |
| HPH Trust USD | NS8U | 1,765 | 24.7 | 1.08 | 17.1 | -6.5 | 0.42 | 0.47 | Industrials |
| Sasseur REIT | CRPU | 897 | 5.9 | 0.55 | 12.4 | -9.2 | 0.85 | 0.86 | REITs |
| China Aviation | G92 | 796 | 7.6 | 0.49 | 11.8 | -0.9 | 0.64 | 0.68 | Industrials |
| TJ DaRenTang USD | T14 | 4,282 | 16.5 | 0.38 | 22.7 | 8.6 | 1.53 | 0.82 | Healthcare |
| ISDN | I07 | 139 | 1.6 | 0.30 | -15.4 | -1.6 | 0.68 | 1.04 | Technology |
| Jiutian Chemical | C8R | 68 | 41.7 | 0.18 | 30.8 | -2.0 | 0.54 | 0.83 | Materials & Resources |
| TC Auto | VI2 | 36 | -15.3 | 0.14 | -44.5 | -0.8 | 1.61 | 2.08 | Consumer Cyclicals |
| Hong Leong Asia | H22 | 610 | -4.1 | 0.12 | 39.8 | 1.6 | 0.64 | 0.58 | Consumer Cyclicals |
| Nippecraft | N32 | 16 | 0.0 | 0.11 | 0.0 | 0.0 | 0.41 | 0.41 | Materials & Resources |
| Ying Li Intl | 5DM | 125 | 172.2 | 0.09 | 145.0 | -0.8 | 0.36 | 0.28 | Real Estate (excl. REITs) |
| China Everbright | U9E | 744 | 13.0 | 0.07 | 38.5 | -0.3 | 0.35 | 0.39 | Utilities |
Note YZJ Shipbldg, CapLand Ascendas REIT, Frasers Cpt Tr, Venture and ThaiBev booked the most net institutional outflow over the 6 weeks. TR refers to total Return, ADT refers to Average Daily Trading Turnover; NIF refers to Net Institutional Inflow, NRF refers to Net Retail Flow. All data as of 9 Oct 2024. Source: SGX & Refinitiv
If you believe that the third wave for the Chinese market is taking shape, investing in Singapore-listed stocks with significant revenue derived from Chinese markets could be a viable alternative. As noted, many of these stocks, as listed above, are currently in their retracement or second wave phase. Could a potential third wave be on the horizon?
This document does not constitute an offer or solicitation to buy or sell any investment product(s). It does not take into account the specific investment objectives, financial situation or particular needs of any person. Investors should seek advice from a financial adviser before investing in any investment products or adopting any investment strategies. In the event that the investor chooses not to seek advice from a financial adviser, he/she should consider whether the product in question is suitable for him/her. The investment product(s) discussed herein are subject to significant investment risks, including the possible loss of the principal amount invested. Any examples provided are for illustrative purposes only. Past performance of investment products is not necessarily a guide to future performance. Weipedia and its affiliates may deal in investment products in the usual course of their business, and may at any given time be on the opposite side of trades by investors and market participants. Any statements or information expressed by other organisations are of the respective authors. Weipedia and its affiliates make no warranty as to the accuracy, completeness, merchantability or fitness for any purpose, of the information contained in this document or as to the results obtained by any person from the use of any information or investment product(s) mentioned in this document. Weipedia undertakes no responsibility to update this document. Weipedia reserves the right to make changes to this document from time to time. In no event shall this document, its contents, or any change, omission or error in this document form the basis for any claim, demand or cause of action against Weipedia and/or any of its affiliates and Weipedia and/or its affiliates expressly disclaim liability for the same. This document is being made available to only certain qualified recipients. In the event that this document or any part thereof is recirculated, transmitted or otherwise distributed in any format to any other person by a recipient, such recipient will have the full responsibility to ensure that such recirculation, transmission or distribution complies with all applicable laws, rules, regulations and directives in all the relevant jurisdictions. Weipedia and its affiliates hereby disclaim all responsibility and liability arising in connection with such recirculation, transmission or distribution.
This article is for educational purposes and not to be regarded as investment advice, a recommendation, or an offer or solicitation to subscribe for, buy or sell any investment product. All forms of investments are subject to risks, including the possible loss of the principal amount invested. Losses can exceed your initial deposit. You should carefully consider your investment experience and objectives, financial situation, and risk tolerance level, and consult an independent financial adviser prior to dealing in any investment products. The contents in the article may have been obtained or derived from public or other sources believed by CMC Invest to be reliable. However, unless otherwise specifically stated, CMC Invest makes no representation as to the accuracy or completeness of such sources or the information, and accordingly accepts no liability for loss whatsoever arising from or in connection with the use of or reliance on the information. Please visit www.cmcinvest.com/en-sg/ for important information. This article has not been reviewed by the Monetary Authority of Singapore.


