How to use ESG data and ratings in the CMC Invest app

CMC Invest
14 December 2022
Get informed
Sign up for our fortnightly Compass newsletter
If you’ve been browsing our app, you may have noticed a little difference recently. You can now access environmental, social and governance (ESG) scores and data – provided by Sustainalytics – for each asset.
This means you can assess whether a company aligns with your principles before purchasing its stock. You can also see how sustainable the holdings in any particular fund are, and whether an investment product has exposure to potentially problematic industries – like gambling or weapons manufacturing.
Below, we’ve put together a quick primer on how to get the most out of the data. If you’re new to ESG investing, we also have a handy explainer on what it is and how to get started.
Important: This article is for general guidance purposes only and should not be considered investment advice. If you are unsure about the suitability of an investment, please seek out advice. When you invest, your capital is at risk.
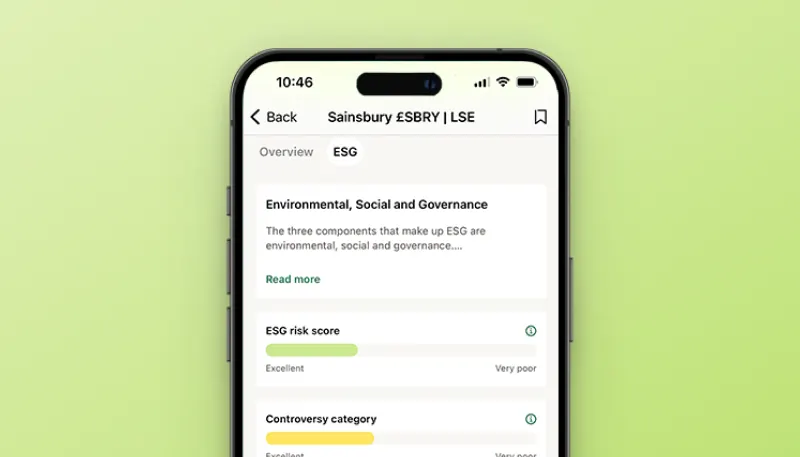
Finding the ESG data in the app
Finding the ESG data in our app is straightforward. On the page of the selected stock or investment product you’ll see two tabs – “Overview” and “ESG”. Selecting the latter will reveal the asset’s ESG data. You may have to scroll down a little to see the tabs.
Once you’ve selected the tab, you’ll see the following data displayed:
For stocks:
ESG risk score
Controversy category
Product involvement areas
For ETFs and investment trusts:
Sustainability rating
ESG risk score (corporate/sovereign)
Product involvement areas (%)
These are explained in more detail below.
ESG risk score
The first piece of data you’ll see is a scale showing a company’s “ESG risk score”. This indicates a stock’s sustainability. It’s based on assessing the company’s overall governance model, its social practices, and its environmental impact. Any controversies the business is involved in are also considered.
A lower ESG risk score indicates a company is more sustainable. A stock can receive one of five ESG risk scores ranging from “excellent” – i.e., being very low risk – to “very poor”.
Funds can have a separate ESG risk score for their corporate holdings (i.e., stocks) or sovereign holdings (i.e., government debt) if they hold both these types of securities in their portfolios.
Controversy categories
Stocks are assessed on whether they are involved in any environmental, social or governance controversies. Once again, companies can score between “excellent” and “very poor”.
The controversy score is used to determine the stock’s overall ESG risk score. You’ll also see “notes” accompanying the score specifying what “category” any controversy issue falls into. For example, whether a company is controversial because of its products or because of how it treats its employees.
Let’s say there’s a company that manufactures solar panels. These are used to produce low-carbon energy – a big plus for its ESG risk score from an environmental standpoint.
It’s subsequently revealed, however, that its staff in one of its factories are paid below minimum wage and put up with unsafe working conditions. This would be noted as a controversy and count negatively towards the company’s overall ESG risk score.
Knowing what controversies a company is involved in can help you identify whether it aligns with your personal principles. It may also hint as to whether it may face pressures and obstacles in the future.
Product involvement areas
This specifies whether a company is involved in any potentially problematic industry. This may be useful if you, as an individual investor, want to avoid exposure to certain sectors.
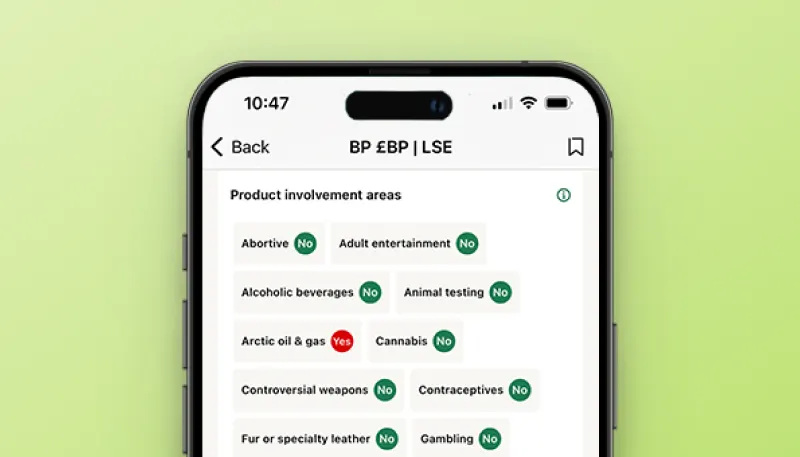
If you want to invest in low-carbon energy, for example, a company focused on renewable power is likely to be of interest to you. It will also probably have an attractive ESG risk score. It may also, however, be involved in nuclear power operations, something that you may not want to be exposed to as an investor.
This data is binary for individual stocks, showing simply whether a company is involved in a certain business sector or not.
Sustainability rating
While individual stocks have an ESG risk score, fund products have a Morningstar Sustainability Rating. This is a demonstration of how well the companies within a funds’ portfolio are managing their operations from an environmental, social and governance standpoint.
Once again, funds can score between “excellent” and “very poor”.
Product involvement areas (%)
For funds, product involvement areas are shown as a percentage. This demonstrates how much of an investment product’s portfolio in exposed to certain industries.
This can be useful for determine the exact nature of a fund’s holdings since product names can sometimes be a little misleading. An “energy” fund, for example, could be invested in wind farms and tidal power initiatives. It could also be exposed to Arctic oil drilling and thermal coal. A quick glance at its product involvement areas should give a rough idea of where its focus lies.
Using this data
ESG investing has its grey areas. What aligns with your principles won’t necessarily match other investors’.
The same logic applies to managers of investment products. What they deem is appropriate for inclusion might not gel with your opinion.
It’s useful, therefore, to see what sectors a fund or stock is exposed to as part of your research so that you can better determine whether a particular investment meets your personal sustainability requirements.
Capital at risk.